4.4. Operations User Interface
The Operations User Interface (OPUI) provides an integrated way to support GMT operations. While the engineering user interfaces provide comprehensive access to the functionality of any subsystem, as described in Engineering User Interface Service, the OPUI supports the operational workflows of the Observatory.
Designed to be flexible, the OPUI can adapt to different operation scenarios, which may be refined or may evolve as operations are optimized over time. Its components are deployed in a web browser. The visualization components access server side information using WebSockets for streaming information like telemetry and RESTful interfaces for configuration or static information. Coupled with the web-based OPUI, the observatory operation workflows define and allow tasks to be performed by different users or teams located in different geographical locations (e.g., GMT site control room, remote observing center, or science operation center). The operation scenarios may be refined or may evolve as operations are optimized over time. In order to provide these capabilities, the architecture of the OPUI is based on a set of modular components that can be arranged according to operation scenarios.
The design of user interfaces can greatly impact the operational efficiency of the observatory. A carefully designed OPUI provides the following benefits:
- Provides a uniform look and feel that guarantees consistent behavior of user interface elements. Consistent behavior makes the system predictable and facilitates a deeper understanding of functionalities that may be critical.
- Provides a common visual and conceptual layout that facilitates communication between different operators or between teams working simultaneously.
- Simplifies the documentation of user interfaces as many aspects can be described from common principles instead of detailed descriptions. Nevertheless the system will allow detailed views into the metadata that make up any UI component or element.
- Simplifies training, especially from remote locations, and reduces human errors.
- Enables the development of “muscle memory” benefiting from familiarity with the same layout and taking advantage of peripheral view.
- Facilitates localization of problems during troubleshooting.
- Enables users early on to provide critical feedback and refinements on operational scenarios and procedures, which in turn feeds back requirements for the whole system.
| Title | Statement |
|---|---|
| Integrated User Interface | The SWCS shall provide an integrated and consistent graphical user interface. |
| Centralized Command Information and Execution | The SWCS shall provide centralized, on-line tools to inform, search, and execute, user commands, and software components. |
| Central Control Functions | Provide central control capabilities for every control subsystem. |
| Software Features Navigation | Provide the capability to discover, navigate, and access efficiently any feature provided by any software component. |
| Operation Console Mode | Provide capability to change programs running in each operation console depending on the operation mode. |
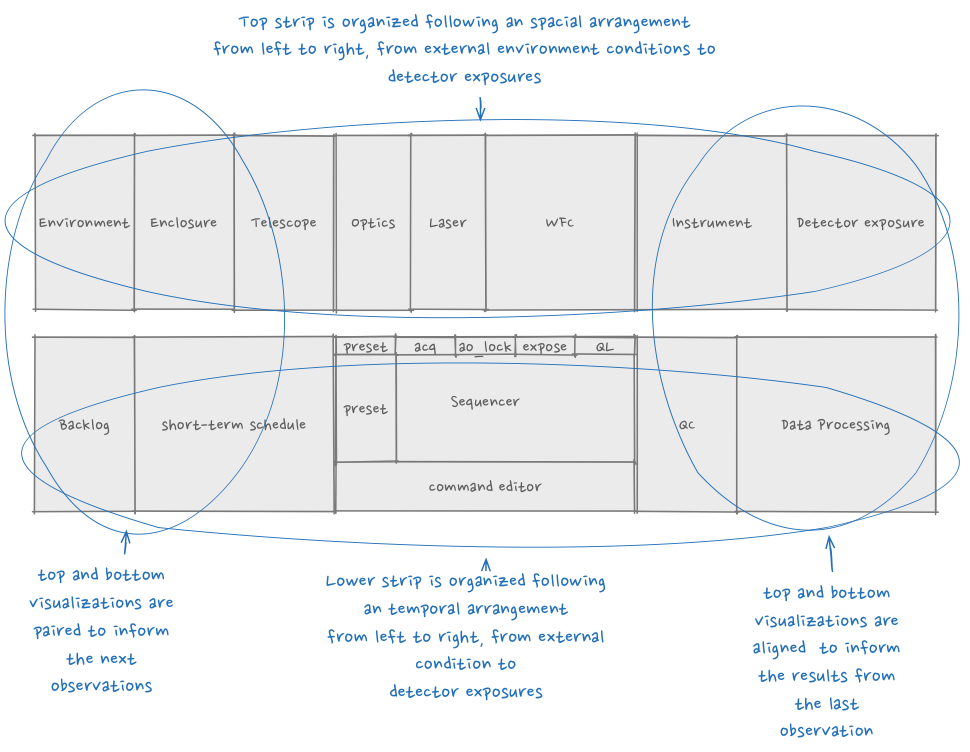
Fig. 4.6 Control Room User Interface Layout. Six 24” equivalent screens organized in two horizontal rows are used to provide the necessary real state. This layout is likely to change as the display technology evolves.
The Figure above shows the layout of a workstation in the control room to control the telescope and the facility. This layout can be similar in a remote operation center, potentially limited only by the refresh rate (24 fps) of the network infrastructure, required for high bandwidth telemetry visualization (e.g., wavefront pixels). This layout strikes a balance in information density and visualization efficiency. It consists of two horizontal strips. The top strip, always visible, provides an overview of the status of the system. Visualization components are arranged, left to right, following the physical location of hardware equipment from the external environment to the instrument detector. This strip is fixed and enables the development of common visual cues that facilitates the communication between system operators.
The components in the bottom strip are organized following a temporal, i.e. workflow arrangement, from left to right, “TO DO”, “IN PROGRESS”, “DONE” areas. The left “TO DO” side is designed to manage work that is pending and to visualize the workflow of the observatory. The left area is focused on choosing and preparing upcoming observations. The central region provides a view of what is currently been executed in the system. During observations, the main interface is the observation Sequencer. The right side provides information on an observation that has just finished and enables one to perform quality control and to process instrument data.
By intent, the left and right side of both strips are also aligned to complement each other. For example, environmental information on the left is paired with the visualization of short term observing sequence candidates while, on the right side, instrument and detector status are paired with quick look and quality control panels. In the center, panels that show status on the laser and wavefront control loops are aligned with the real-time step sequencer to provide efficient real-time monitoring of the system.
In the case of classical observing mode, a single person may perform all the necessary steps from left to right. In queue or service mode, several persons, perhaps distributed in different or distant locations, may collaborate to carry out operations. For example, one team or person can focus on preparing a short list of observations for the night, while another may focus on the on-going observation. Another person may be analyzing the results from previous observations and monitoring the (re)processing of science data. The parallel execution of these activities maximizes observing efficiency.
Some variations can branch off from the basic “double strip” configuration to better address specialized use cases, e.g., AO, Instrument or telescope centered workstations. Some of the panels can be standalone in other contexts, e.g., the workflow panel (Kanban Workflow panel) can be deployed in large screens in critical areas of the observatory to provide a global view of the work in progress at the observatory. Some of the panels are intended to exploit the benefits of different portable media, e.g., tablets, phones or laptops. Tablets and augmented reality displays already provide access to information in the operations of industrial plants. Observatory engineers diagnosing problems outside the control room can send commands remotely and immediately witness the results without running to-and-forth. This ability relies on having proper groupings of informational panels.
Although the OPUI is composed of several panels, the description of all of them is outside the scope of this document and their detailed design will proceed accordingly in future stages of the project. The observatory workflow panel is presented as an example as it provides an overall view of the work at the observatory. This panel is designed according to principles derived from Lean and Agile management, following basic principles on the visualization of quantitative data:
- Information access – Information is accessible to inform operator decisions without the need to search multilevel menus or to click on several “disclosure triangles.”
- Data presentation – Quantitative data are presented in a way to facilitate comparisons of relevant criteria and to promote understanding of the statistical distribution of the datasets.
- Visualization of workflow – In order for users to comprehend or reason through various activities that take place in an observatory, it is important to provide an easy, uniform, and global, visualization to understand the different observatory workflows. The visualization of observatory activities is based on the notion of Kanban boards. A Kanban (scheduling system) provides an ability to represent items of interest and to track their progress through different stages in a production process. Observatory analogies include the process of an observation, or of solving hardware “bugs.”
- Monitoring, adaptation, and improvement – The use of performance metrics that are updated in real time allows one to detect bottlenecks and to take relief measures. Both human tasks/activities and automated tasks, engineering and observation activities, can be depicted on the Observatory Flow board. Real-time feedback on performance enables operations staff to understand the implications of reallocating work unit (e.g., observing block) from one step in a process to another: when one unit of work changes state (to do -> execution -> complete), how much all other criteria are affected are rigorously quantified and immediately updated. One of the goals is to provide a set of tools that is sufficiently general, that benefits, but that does not tailor to a specific operation mode (classical observing, queue, etc.). For example, in classical observing mode, only the PI decides which process items (e.g., observations) move from one stage to another. However, the collaborating observers can be distributed in different locations around the world to take advantage of normal daytime work hours in some time zones.
- Pull work from stage to stage – Geographically distributed teams can pull work units from stage to stage. Observing and scheduling tools assist in the tasks of moving work units through the system.
- Limit work-in-progress – Excessive number of work units in a stage limits the productivity of the teams responsible for those work units. Visualizing the practical limits of work-in- progress for every stage enables one to identify possible planning deficiencies, to cue the teams to take corrective measures, and to continuously improve the process.
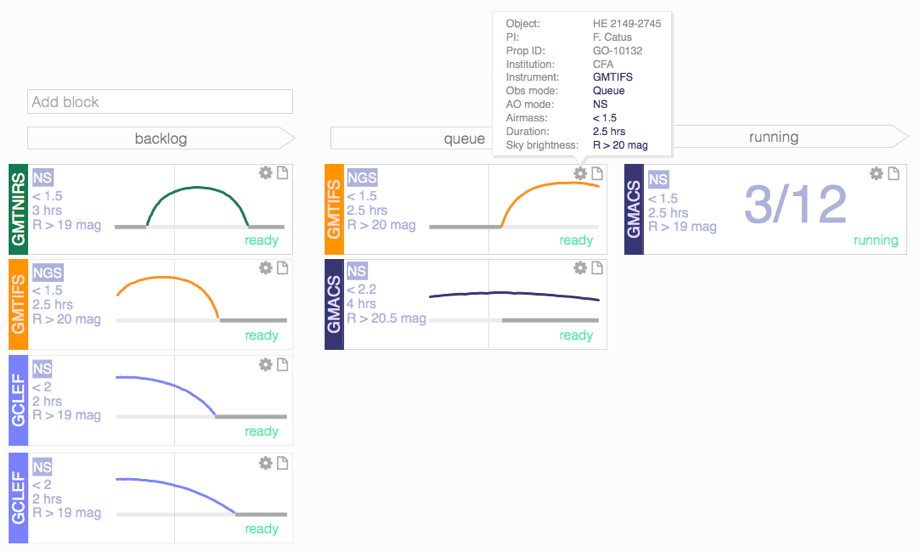
Fig. 4.7 Partial view of the Kanban workflow panel. Work units, observing blocks in the figure, are arranged according to their state. Operations staff arrange them from column to column with the assistance of tools that implement ranking and filtering algorithms.
An important component of the OPUI (Figure above) is the Sequencer panel, which is described in more detail in the Sequencer Section.