4.11. Data Processing System
Data from the observatory, whether related to science, engineering, environment, facility, etc., usually require some form of data processing before they can be further used in a workflow. The Data Processing System (DPS) provides a general way to process operational data during observatory operations that is highly customizable to meet runtime conditions. The types of data processing potentially include those from instruments, sensors, wavefront processing, detectors, telemetry, interlock and safety, database management, etc. The SWCS Requirements derived from the SLR are:
| Title | Statement |
|---|---|
| Efficient Operations | The SWCS shall identify and define sequences for instruments, telescope, and science, operations to optimize on-sky observing efficiency and to comply with GMT Efficiency Budget (GMT-SE-REF-00593). |
| Telescope Operators, Instrument Specialists, and AO specialists | The SWCS shall be designed to efficiently support the roles (operations, setup) of Telescope Operators, Instrument Specialists, and AO specialists. |
| Quick Look | Provide software to facilitate near real-time assessment of data quality for each instrument. |
| Observing Program Execution | The SWCS shall provide software tools to execute Observing Programs. |
| Engineering Data Management System | Provide hardware and software to collect, store, retrieve, analyze, and display engineering data to monitor the performance and health of the GMT system and environmental information. |
| Calibration Efficiencies: AO, WFS, daytime, nighttime, routine, non-routine | The SWCS shall provide the capability to perform or support calibrations of all subsystems, instruments, AO, WFS, daytime, nighttime, routine, and non-routine calibrations within the time window specified in their respective requirements. |
Data processing refers generally to a system that takes input information or data and performs operations (analysis, summary, conversion, etc.) and then outputs other useful or desired information. The types of processing usually involve any combination of the following operations: conversion, transformation, analysis, aggregation, sorting, and validation. In the context of Observatory Operations, the categories of processing more specifically mean the following:
- Conversion – Data conversion mostly repackages, renormalizes, or reformats the input information in a different way required by software or users, but otherwise preserves the context (i.e., a data table converts to another data table) of the original input data. Data conversion is sometimes useful as a communication conduit, or a thin interface, between different software and hardware components. Other examples include conversions of: file structure or type (e.g., from observatory standard to FITS file, ASCII to binary, lossless data compression), astrometric coordinates (celestial coordinates to pixel coordinates), spectrum wavelength scale (e.g., pixel to wavelength), equinox coordinates (e.g., equinox B1950 to J2000), flux scale (pixel counts to magnitude) etc.
- Transformation – Data transformation alters the input data in some significant way, the goal of which is not to change the format or structure, but rather to prune, improve (in some sense), or make corrections to the data. Examples of data transformation involve: bad pixel interpolation or masking, image un-distortion, shifting, binning, rotation, magnification, image (de)convolution, smoothing, data filtering, feature subtraction (sky lines in spectroscopy), bias subtraction, flatfielding, etc. Data transformation can either be atomic operations or highly complex, involving a series of steps. The creation of an IFU data cube is an example of a complex transformation. It involves data (spectral) extraction, a change in the data structure, and data combination. Both the input and output may be in FITS data format, but the output is in data cube form instead of the original 2-D image of spectra. The output is a much more useful format for quick-look assessment of the data quality compared with the data in its native, recorded, state.
- Analysis – Data analysis involves interpretation, inference, synthesis, summary, and/or numerical computation, of input information that on output produces entirely new information. This category includes both statistical and numerical analysis. Statistical analysis involves summary of, as well as inference from data. Examples of numerical analysis are linear algebra operations, optimization of large numbers of variables, interpolation, etc. Common uses of analysis in observatory operations include: estimation of background noise, signal-to-noise of sources, centroid mean, regression, seeing statistics, statistical analysis or cross correlation of telemetry, source or feature extraction, matrix inversions (e.g., wavefront sensing applications), equation solving, model generation (e.g., AO PSF simulations, image or spectra creation), noise generation, and optimization of telescope scheduling.
- Aggregation – Aggregation takes multiple data sets of similar context, and either combines them in some way, or extends/appends the data set. Examples include science image and spectra combination (e.g., mosaic creation), data reduction and calibration (bias frame combinations, darks, flats, etc.), merging telemetry data tables (e.g., for use in TPoint), etc.
- Sorting – Sorting involves reorganizing an ordered sequence of data into another ordered sequence, following some numerical weights or rules. Examples include schedule ranking based on parameter values, sorting by proximity to coordinate, etc.
- Validation – This process validates that the data taken are useful and may involve testing the integrity (data can be read correctly), completeness (e.g., having all supporting data), correctness (e.g., data format, pointing to correct object/field, proper filter), quality (e.g., high S/N, adequate PSF Strehl or S/N), and absence of errors.
4.11.1. Subsystem Design
The DPS, as with other OPS components, consists of a server and visualization, sequencing, diagnosis, workflow, management, and hardware packages. The DPS is designed according to a software pipeline pattern, meaning that each pipeline consists of filters (processing elements), connected in series, where the output of one filter feeds into the input of the next. The relationship between the server, pipelines, and filter (processing elements) is shown graphically in Figure 4.18. Pipelines allow the functionality of the system to grow, evolve and adapt easily and dynamically with new instruments or desired capabilities without having to recompile from source code. Pipelines integrate directly into automated processes of the observatory using only simple software wrappers or interfaces, and enable the observatory staff to compose new operational recipes from existing pipelines. Furthermore, experience has shown that wrapping pipeline filters can expedite software documentation.
Instrument data pipelines are an especially good application for DPS modeling. Each data pipeline can be created for each instrument or detector based subsystem. Pipelines include recipes for quick-look, calibration, and end-to-end data reduction. For each instrument that has multiple operating modes but share many similarities, filters can be combined based on recipes that are customized to each observing mode. The result of the execution of a recipe is a set of observing and calibration data.
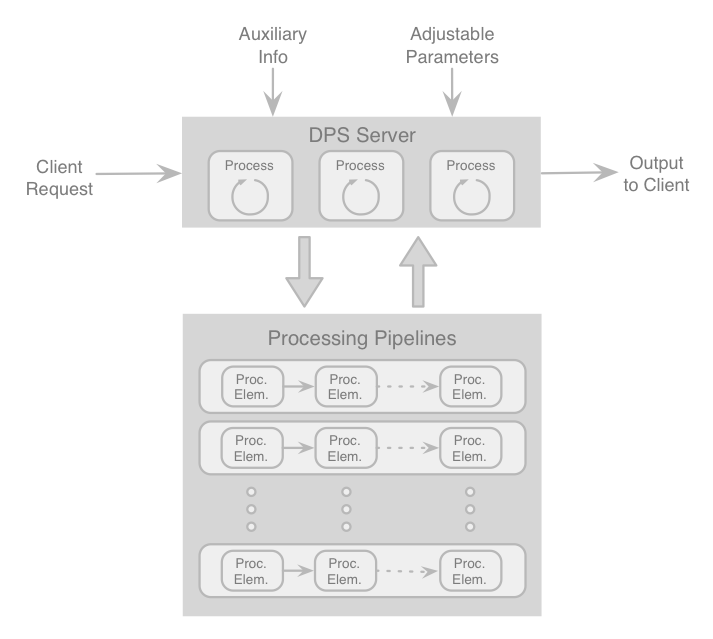
Fig. 4.18 The Data Processing System, showing the workflow and relationship between the Server and the Pipelines in the DPS. The data processing pipelines are made up of filters (labeled as processing elements) that are connected in series. Each pipeline produces a specific data product upon output. Although presented as linear pipelines, in reality filters are application modules that are used or shared among multiple data pipelines, often simultaneously. Multiple data pipelines may be running in parallel, and multiple copies of the same pipeline may be invoked, at any given time.
As illustrated in Figure 4.18, at the highest level, the DPS follows a client/server model for the purpose of distributed computing. The DPS therefore comprises a Server and Processing Pipelines, their roles being:
- The Pipeline Server – The pipeline server is the access point into the DPS by clients, which make job requests to initiate job processes. The server manages and orchestrates all computation workflows. As discussed earlier, the purpose of the server-client model is to relieve clients from having to know about the implementation, the computation details, and the efforts needed to perform a process. If a process is computationally intensive and requires GPU or parallel data processing, it is the responsibility of the server to ensure that enough resources are allocated to that process. Each process can trigger multiple pipelines sequentially or in parallel, overseen by the server. The server knows when all the data from the different parallel processing threads complete, so that the process is ready to execute the next pipeline in the workflow. Furthermore, users or software may create, spawn anew, or reconfigure data reduction pipelines on-the-fly, by rearranging processing elements, via a pipeline (workflow) editor (analogous to Sequence editors). This enables users to adapt to changing runtime situations trivially without having to learn the programming environment.
- Pipelines and Filters / Processing Elements – In the DPS, there are several categories of data processing pipelines that are natural to Observatory Operations, as elaborated in Pipeline Applications. Each pipeline produces a specific form of data product, such as reduced FITS images (i.e., bias, dark, and flatfield corrected), data blocks, look-up tables of flexure and astrometric maps. Any client (i.e., software or user), can access all the data pipelines, as well as the individual filters (Figure 4.18), directly via the server. The difference between pipelines and processing modules is that processing elements may be indivisible software tools that come as commercial products or already pre-assembled (e.g., SExtractor [BeAr96]). All such modular tools form the basis of the Common Framework libraries (Frameworks), which the SWCS uses to build other tools or software pipelines. Whenever possible, the filters will be based on tools and applications that are commonly used in astronomy, already part of the Linux operating system, open-source tools, or pre- existing commercial software. A user (or a software tool) can create new pipelines, and can modify existing ones, by rearranging the filters via a pipeline user interface to produce a data product.
4.11.2. Pipeline Applications
For Observatory Operations, the types of pipelines generally fall into the categories of signal processing, statistics, astrometry, coordinate transform, image matching, data reduction and calibration, and model synthesis. Each of those pipeline categories is summarized here briefly:
- Signal Processing – The signal processing pipeline handles recording, measurements, shaping, or analysis of signals, including time varying or spatially varying signals. Some of the most common signals include: temperature, pressure, encoder positions, images, and spectra. Examples of the type of pipeline include: telemetry extraction and look-up table generation, automated telescope pointing analysis and pointing model creation, filtering of data stream (e.g., encoder readouts), image enhancement, noise reduction, feature detection or extraction from images or spectra for creating data cubes, etc.
- Statistics – In addition to performing basic statistics, statistical pipelines perform all the pre- processing and data extraction necessary. For instance, computing the background sky and noise level of an image or a spectrum may require source detection and masking.
- Astrometry – Given an asterism of stars and galaxies in an image, and a large database of astronomical catalog of objects, this pipeline performs astrometric matching to attach a coordinate system to the image, accounting for geometric distortions. In addition to positions, asterism matching can also involve relative brightness of stars and galaxies as well as their colors.
- Coordinate Transform – Solves for and evaluates transformations between two different coordinate systems, whether in images or in spectra. This is often used to facilitate accurate alignment of images or spectra, or to solve for wavelength solutions.
- Image Matching – The Image Matching pipeline automatically figures out the alignment between two images and matches them, either via PSF matching or flux scaling. While image matching may use the coordinate transformation pipeline to register the images as part of the process, additional uses of the image-matching pipeline may involve image co-addition or subtraction, where it is also necessary to match the PSF and intensity scaling, or some other criteria.
- Data Reduction and Calibration – This pipeline removes instrumental signatures from engineering and science detectors and sensors. Data reduction and calibration pipelines include image reduction (bias, dark, flat fielding), and spectroscopy reduction (sky line subtraction, wavelength calibration, spectral response correction). It is the first step toward many applications, including quick look and S/N calculation purposes, for queue observing to validate the quality of data, and for creating image cubes for IFU data.
- Model Synthesis – A model synthesis pipeline facilitates the creation of artificial models for exposure time calculations. The pipeline helps to generate AO PSFs based on the locations of guide stars in a detector field of view relative to the science targets, and applies the PSFs to galaxy and spectral models to generate realistic images. Details of this application are discussed in Observing Tools.
- Data Trending – The data trending pipeline facilitates discovery of correlations in the data with time, telescope pointing position, or between parameters. This may involve automated or supervised extraction and analysis of telemetry, quality monitoring, telescope flexure and pointing model data.